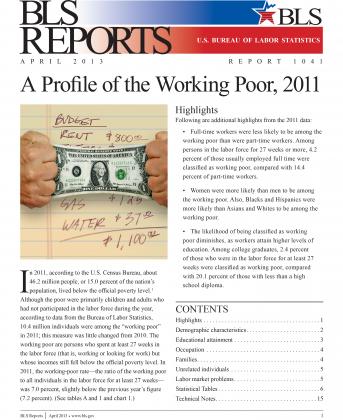
Who are the working poor in America?
Data from the Bureau of Labor Statistics
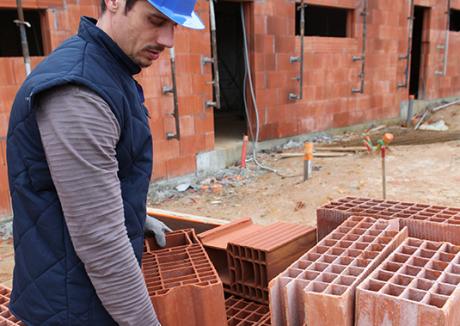
The “working poor” are people who spend 27 weeks or more in a year in the labor force either working or looking for work but whose incomes fall below the poverty level. According to the U.S. Bureau of Labor Statistics, 6.4 million people who spent at least 27 weeks in the labor force were poor in 2022 (the most recent year in which such figures were published). The working-poor rate—the proportion of the working poor among all people in the labor force for at least 27 weeks—was 4.0 percent in 2022.
The majority of the people who live below the poverty level do not work, but this includes children, the elderly and the disabled poor. Among the poor between ages 18 and 64 who are not disabled or in school recent BLS working-poor profiles continue to show that while many of the poor have some labor market attachment, only a fraction work most weeks of the year.
In 2022, the working poor as a fraction of all people in the labor force for 27 weeks or more were:
- Hispanic/Latino: 7.2%
- Black: 6.0%
- White: 3.8%
- Asian: 2.8%
- Women: 4.4%
- Men: 3.7%
- Less than high school diploma: 12.6%
- With a bachelor’s degree or higher: 1.4%
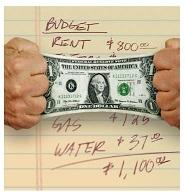
Are wages or jobs the problem for the working poor?
The connection between poverty and labor markets is complex. High, stable wages and stable full-time employment can keep many out of poverty. However, stagnation of wages at the bottom of the US wage distribution over the past several decades and continuing low rates of full-time work, especially in single-parent households, often leave families below the official poverty threshold.
In 2022, 84 percent of the working poor who usually worked full time experienced at least one of the major labor market problems, according to the Bureau of Labor Statistics. Low earnings continued to be the most common problem.
Whether employment status reflects supply or demand factors remains a question. Poverty is substantially higher in states where wages at the bottom of the distribution are lowest. Poverty rates are typically higher in states where wages at the bottom of the distribution are lowest, and low-wage labor markets are closely linked with higher working-poor rates.
Updated 12/15/25
For more information:
U.S. Bureau of Labor Statistics. A Profile of the Working Poor, 2022. BLS Report 1110.
U.S. Census Bureau. Poverty in the United States: 2022. Current Population Reports, P60-280.
Shrider, EA and Bijou, C. Poverty in the United States: 2024. Census Bureau, September 2025.
Stevens, Ann. 2016. “Labor Markets and Poverty in the US: Basic Facts, Policy and Research Needs.” UC Davis Center for Poverty Research.
U.S. Bureau of Labor Statistics. 2016. “A Profile of the Working Poor, 2014.” BLS Report 1060.