Transitions into & out of Poverty in the United States
By Ann Huff Stevens, UC Davis

Transitions into and out of poverty often happen after major events such as marriage, divorce, or changes in income. They are also associated with economic factors, such as unemployment rates or wages.
Understanding the impacts of each can show the difference between short-term, circumstantial poverty and longer-term poverty associated with more permanent limitations on earnings, employment and family structure.
In a recent study, Center for Poverty Research Director Ann Huff Stevens finds that in the U.S., individual weeks worked and aggregate wage levels are the important predictors of how many escape or avoid poverty from one year to the next.
Key Findings
- Increased time spent in poverty is associated with lower chances an individual will exit poverty, which ranges from 56% after one year poor to 13% for those in poverty for 7 or more years.
- A 3% increase in the regional unemployment rate, which is roughly the magnitude experienced at the beginning of a recession, reduces the exit rate from poverty by approximately 6% per year, and raises the annual rate of re-entry into poverty by 9%.
- The decline of approximately $100 in the 20th percentile of individual real weekly wages between the early 1970s and the mid-90s is estimated to have reduced the annual exit rate from poverty by 15%.
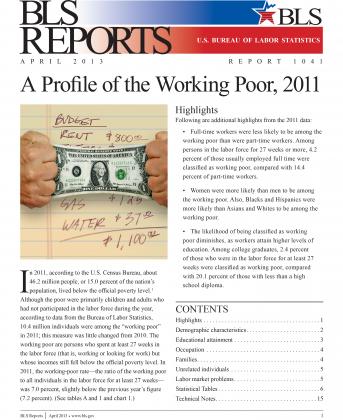
In 2010, 46.2 million people—over 15 percent of the total U.S. population—lived below the poverty line. Among them were more than 10.5 million working poor—individuals living below the poverty line but who also worked for 27 weeks or more that year.
When the poverty rate increases, as it has most years in the U.S. since 1999, it is because either more individuals fall into poverty or fewer find ways to escape it. In addition to identifying individual causes for poverty transitions, this study incorporates labor market factors, such as regional unemployment rates and wage levels, into models of the probability that an individual will enter or exit poverty from year to year.
This study emphasizes that patterns of poverty transitions may often reflect fairly complex interactions—in this case a three way interaction over time between aggregate labor market conditions, individual weeks worked in the year and changes in family structure.
Estimating Probabilities
Stevens uses data from the Panel Study of Income Dynamics (PSID)
starting in 1968, the first year the data was collected, through
2003. The study’s poverty transition models incorporate
individual characteristics such as gender, age, race, employment
and time spent in poverty. The models also include family
characteristics such as the head of household’s educational level
and whether one or two parents are present.
To incorporate labor market conditions, Stevens uses variation in unemployment rates and wages from the 1975-03 Current Population Surveys across geographic regions and years. The 20th percentile of weekly earnings for full-time male workers is used to capture the role of declining or stagnant wages over the past several decades.

Individual Events and Poverty
Approximately one quarter of all spells of poverty begin with a
loss of income for the head of household or spouse, but with no
major change in family structure. Between nine and 14 percent of
adult transitions begin with no loss in income, but an increase
in financial needs brought about by an increase in family size.
Higher earnings account for 22 percent of transitions out of
poverty.
One quarter of all poverty spells begin after divorce, separation or other major change in family structure. More than a quarter of children’s transitions into poverty coincide with a change in the head of household. For both women and children, these transitions usually involve the departure of a male head of household.
Changes in income and family structure are also associated with transitions out of poverty. A child who splits off to become a new head of household may reduce the financial need of the original family, but may form a new household that remains below the poverty line. The addition of a parent with income also makes a difference—a change in the head of household coincides with 17 to 24 percent of transitions out of poverty.
Time in Poverty
Across the entire sample, the average spell of poverty lasted 2.8
years. The longest were among households headed by single women
(3.1 years), African American men (2.7 years) and those with less
than a high school diploma (2.6 years).
Many individuals experience multiple spells of poverty, so that these spell lengths substantially understate the total time spent in poverty. Thirty-six percent of individuals return to poverty within four years of ending a spell. Among households headed by African Americans or single females, rates of re-entry within four years are 46 to 50 percent.
Exit probabilities fall as the duration of the poverty spell
increases. The exit rate from poverty is 56 percent after just
one year poor, but falls to 13 percent after seven or more years
in poverty. Similarly, rates of return to poverty decline
with time spent out of poverty.
Weeks Worked and Income
Given the dramatic changes in U.S. wages over the past 40 years,
it is natural to ask how these movements affected poverty
transitions. At the 20th percentile of weekly wages, real
earnings declined from $473 in 1975 to $386 in 1995 before
increasing to $424 by 2000. The transition models show that a
decline of $100 in real wages reduces one’s chance of exiting
poverty by around 15 percent.
Between 1975 and 1995, real wage levels and hours of work in the U.S. changed substantially for many low-skilled workers, which had clear effects on poverty transitions. Actual exit rates from poverty declined during these years from 38 to 34 percent, but would have increased by three percentage points if wage levels and hours worked had held steady.
Attachment to the labor force is also critical. Employment for 30 weeks out of the year rather than 20 raises the poverty exit rate by 16 percent and lowers the chances of re-entering poverty by a third.
Meet the Researcher
Ann Huff Stevens is the Director of the Center for Poverty
Research and Chair of the Economics Department at UC Davis. Her
research interests include the incidence and effects of job loss,
understanding connections between economic shocks and health, and
poverty dynamics.
References
U.S. Census Bureau, “Poverty: 2010 and 2011,” September, 2012
U.S. Bureau of Labor Statistics, “A Profile of the Working Poor,
2010,” January 2013 U.S. Census Bureau, “Historical Poverty
Tables – People”
doi:10.15141/S55P4F