Small Area Income and Poverty Estimates (SAIPE)
Model-based Small Area Income & Poverty Estimates for School Districts, Counties, and States


The U.S. Census Bureau’s Small Area Income and Poverty Estimates (SAIPE) program provides annual estimates of income and poverty statistics for all school districts, counties, and states.

The main objective of this program is to provide estimates of income and poverty for the administration of federal programs and the allocation of federal funds to local jurisdictions.
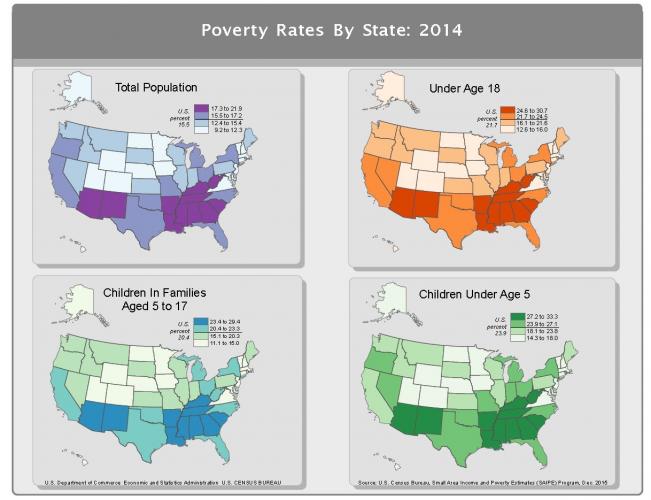
In addition to these federal programs, state and local programs use the income and poverty estimates for distributing funds and managing programs.

Frequency and Timespan: Mostly annual from 1989 to the present

Geographic Level of Coverage: States, counties and school disticts

Tables and maps are available online

Source:
U.S. Census Bureau.Model-based Small Area Income & Poverty Estimates (SAIPE) for School Districts, Counties, and States (Web Site) Accessed 7/9/2014

By 2010, the Census Bureau employed optical scanners and computer software were used to convert handwritten questionnaires into electronic data. Photo courtesy U.S. Census Bureau.

How is poverty measured in the United States?
The two federal poverty measures in the U.S.

Each year, the U.S. Census Bureau counts people in poverty with two measures. Both the official and supplemental poverty measures are based on estimates of the level of income needed to cover basic needs. Those who live in households with earnings below those incomes are considered to be in poverty.


How does geography relate to poverty?
Data for regional and concentrated poverty

In 2015, poverty rates across the four Census geographic regions ranged from 11.7 percent in the Midwest, 12.4 percent in the Northeast, 13.3 percent in the West and 15.3 percent in the South. Because of the South’s largest share of the total U.S. population, it has the largest number of people who live in poverty compared to any other region.

What do we know about the geographic concentration of poverty?
Estimates from the American Community Survey


In 2010, 15% of people lived in poverty.  Poverty is not evenly distributed across neighborhoods and every state has neighborhoods with higher than average poverty rates.