The Supplemental Poverty Measure: A Better Measure for Poverty in America?
By Anupama Jacob, 2012 Visiting Graduate Scholar
In 2012, the U.S. Census Bureau reported that around 46 million or one in seven residents lived in poverty. However, the very term “poverty” continues to evoke debates on what it means to be poor.
Ideological, political, and methodological tensions make it extremely challenging to reach a consensus on the most appropriate way to measure poverty in a given society. So how do we distinguish between the poor and the non-poor?
A looming question today is whether the official measure still provides an accurate picture of the poor in America. The measure has in fact long been considered outdated and imperfect (Citro & Michael, 1995; Blank & Greenberg, 2008; Besharov & Couch, 2009). For example, the poverty thresholds do not take into account regional differences in costs-of-living and are only adjusted annually for inflation.
The official measure has further been criticized for not considering the significant demographic, economic, and welfare policy changes that have occurred over the past five decades. Food, for example, comprised about a third of the average family’s budget when the official measure was instituted in the 1960s. Today it comprises less than half of that.
The official thresholds are also left insensitive to other expenditures such as housing, health care, and child care that today make up a larger percentage of a typical family’s budget than it did before. The measure also does not account for the increasing number of poverty alleviation programs that have been launched to help low-income families since the 1960s that provide in-kind or after-tax benefits (Blank, 2008).
Origins of the Official Poverty
Measure
The official U.S. poverty measure was developed in the 1960s by
Mollie Orshansky, a Social Security Administration economist, in
conjunction with President Johnson’s War on Poverty. Using the
1955 Household Food Consumption Survey, Orshansky determined that
the average family spent one-third of their after-tax family
income on food. She then multiplied the cost of a minimum diet
food plan by a factor of three to obtain poverty thresholds for
families of different sizes and compositions.
In 1969, President Johnson’s Office of Economic Opportunity officially designated the “absolute poverty line” as the threshold below which families or individuals lacked the resources, measured as pre-tax cash income, to meet one’s basic needs (Citro & Michael, 1995).
The Supplemental Poverty Measure
Although Orshansky developed her measure of poverty based on the
best data available at that time, the question is if it provides
a clear picture of how economic, social, and policy changes
affect economic need in the United States today. The official
poverty rates may in fact lead us to believe that “public
spending on the poor had little effect” (Blank, 2008, p. 238).
In the early 1990s, Congress commissioned a panel of experts from the National Academy of Sciences (NAS) to address key shortcomings of the official measure. In early 2010, the Obama administration adopted the Supplemental Poverty Measure (SPM) that largely follows the methods recommended by the NAS Panel.
Following the Panel’s recommendations, the SPM defines poverty as the lack of economic resources for consumption of basic needs such as food, housing, clothing, and utilities (FCSU). To determine family resources, gross money income from private and public sources is supplemented with benefits such as food stamps, housing subsidies, and tax credits. Deducted from family income are medical out-of-pocket expenses including health insurance premiums, income and Social Security payroll taxes, child support payments, work-related expenses and child care costs.
Instead of using a food plan, the SPM poverty thresholds are based on expenditures on FCSU plus a small amount to allow for additional expenses. These thresholds are further adjusted for different family sizes and compositions, housing status, and geographic differences in housing costs (Short, 2012).
Measure for Measure Differences in
Poverty
Using the 2012 Current Population Survey Annual Social and
Economic Supplement, Short (2012) estimates poverty rates based
on the SPM for the year 2011 for the total population and
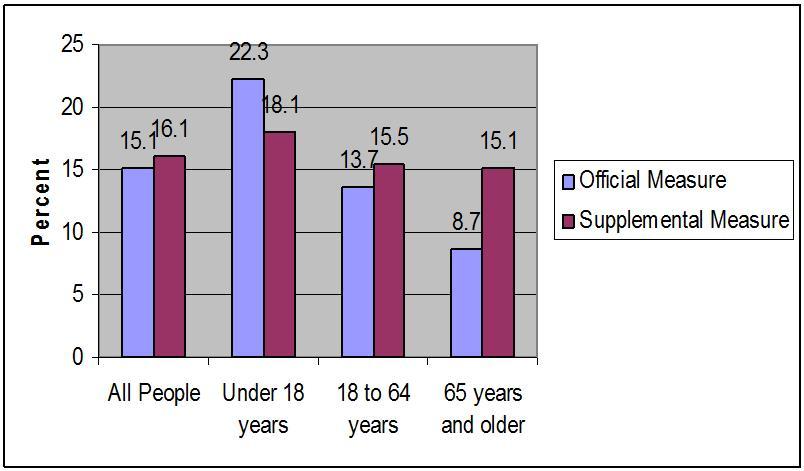
different age groups (see Figure 1). Figure 1 shows that the
estimated SPM poverty rate is 16.1 percent compared to the
official rate of 15.1 percent. Poverty rates are also higher for
those aged 18-64 years and those aged 65 years or older.
The inclusion of out-of-pocket medical expenses helps explain the increase in poverty among the elderly population. The child poverty rate decreases under the SPM measure. The inclusion of tax credits such as the EITC and other in-kind benefit programs that help families are believed to contribute to this decrease.
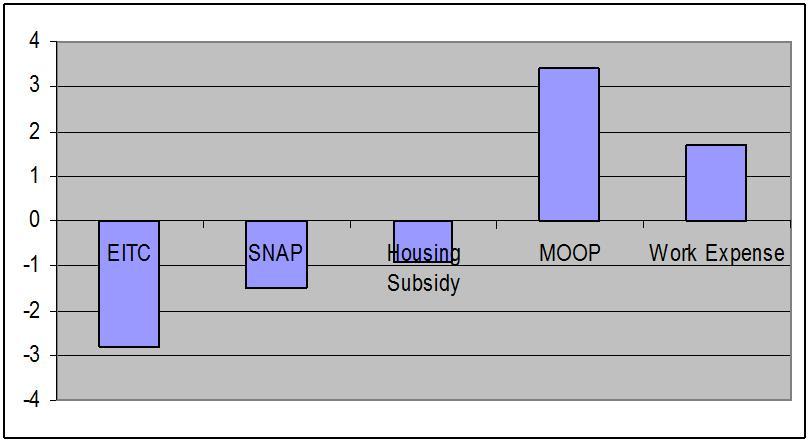
Figure 2 shows the effect of poverty alleviation policies on the poverty rate using the SPM. Including the EITC lowers the poverty rate from 18.9 percent to 16.1 percent. Benefits such as food stamps (SNAP) and housing subsidies also lower the poverty rate. In contrast, poverty rates increase once child care and medical out-of-pocket (MOOP) expenses are accounted for.
Although the supplemental measure will not be used to determine federal allocation of funds or program eligibility, it will serve as a complementary statistic to enhance our understanding of economic circumstances and trends of low-income families. The measure can also help policymakers better identify which groups are being helped by public assistance and which groups remain in poverty despite government assistance. Obtaining this information can provide a more lucid picture of poverty in America for policy evaluation and the development of alternative poverty alleviation strategies.
Meet the Researcher
Anupama Jacob was a 2012 Visiting Graduate Student
Scholar at the Center for Poverty Research at UC Davis. She is a
Ph.D. candidate at the School of Social Welfare at UC Berkeley.
Her research interests include poverty and inequality, poverty
measurement in the U.S., welfare state theory, community
development and housing policy.


