Areas with Concentrated Poverty ACS and Other Sources
Areas of Concentrated Poverty (ACS)
These Census Bureau report analyzes demographic and socioeconomic
characteristics of census tracts by categorizing the tracts based
on their poverty levels. Tracts with poverty rates of 20% or more
are considered “poverty areas”. Recent reports draw data
from the America Community Survey and older data come the the
Census long form.
Frequency and Timespan: Reports issued irregularly, data for the
the period 1990 to 2010
Geographic level of coverage: Estimates of concentrated poverty
for states and regions
U.S. Census Bureau, Changes in
Areas with Concentrated Poverty: 2000-2010. American Community
Survey Briefs ACS-27 (PDF)
U.S. Government Printing Office, Washington, DC, 2014.
Accessed 10/9/2014 U.S. Census Bureau, Areas with
Concentrated Poverty: 2006-2010. American Community Survey Briefs
ACSBR/10-17 (PDF)
U.S. Government Printing Office, Washington, DC, 2011.
Accessed 7/16/2013 U.S. Census Bureau. Poverty Areas.
Statistical Brief, June 1995 (HTML)
Accessed 8/9/2013
U.S. Census Bureau. Areas with Concentrated Poverty: 1999. Census
2000 Special Reports CENS-16 (PDF) U.S
Government Printing Office Washington, DC, 2005. Accessed
8/9/2013
Concentration of Poverty in the New Millennium
This report, authored by Paul A. Jargowsky, compares the 2000
census data with the 2007-11 American Community Survey (ACS),
revealing the extent to which concentrated poverty has returned
to, and in some ways exceeded, the previous peak level in 1990.
Frequency and Timespan: One-time report covering 1990 to the
present
Geographic level of coverage: Estimates of concentrated poverty
for states and regions, some local area data
Sources:
Jargowsky, Paul A. Concentration of Poverty in the New
Millennium: Changes in Prevalence, Composition, and Location of
High Poverty Neighborhoods (PDF).
The New Century Fund and Rutgers Center for Urban Research and
Education, 2013. Accessed 10/9/2014
Each year, the U.S. Census Bureau counts people in poverty with
two measures. Both the official and supplemental poverty measures
are based on estimates of the level of income needed to cover
basic needs. Those who live in households with earnings below
those incomes are considered to be in poverty.
In 2024, poverty rates across the four Census geographic regions
ranged from 9.7 percent in the Midwest, 9.8 percent in the
Northeast, 9.9 percent in the West and 11.9 percent in
the South. Because of the South’s largest share of the total U.S.
population, it has the largest number of people who live in
poverty compared to any other region.
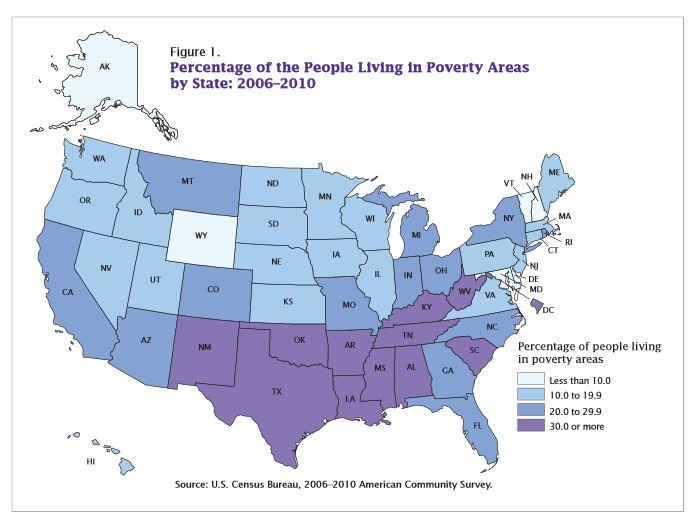
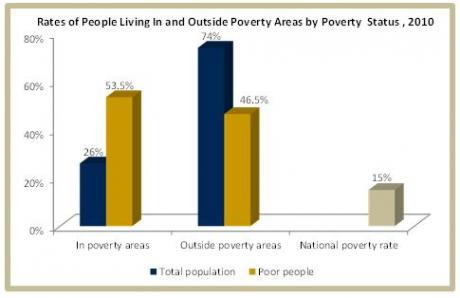
In 2010, 15% of people lived in poverty. Poverty is not
evenly distributed across neighborhoods and every state has
neighborhoods with higher than average poverty rates.