What are the major federal safety net programs in the U.S.?
A summary of efforts to reduce poverty in the U.S.

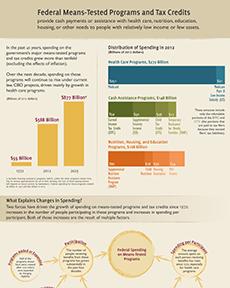
Some of these programs are entitlements. Everyone can expect to receive an Earned Income Tax Credit if they qualify. Other programs, like the nutrition assistance programs SNAP and WIC, only benefit those who claim them before the budgeted funds run out.
Here is a timeline and summary of selected safety net programs in the U.S.
1935: The Social Security Act
Part of President Franklin Roosevelt’s New Deal legislation, the original act included grants to states for unemployment compensation, aid to dependent children and public health. Today, Social Security is the largest safety net program in the U.S. In 2017 it will reach an estimated 62 million Americans with $955 billion in benefits.
For more information visit the Social Security Administration online.
1935: Unemployment Insurance
Unemployment insurance was a part of President Franklin Roosevelt’s 1935 Social Security Act. Today’s U.S. Department of Labor Unemployment Insurance (UI) programs provide benefits to eligible workers who become unemployed through no fault of their own and who meet certain requirements.
The program is a unique federal-state partnership, based on Federal law, but administered by individual states. The Congressional Budget Office estimates that UI benefits totaled $32 2016 when the unemployment rate averaged 4.6 percent.
For more information about Unemployment Insurance, visit the Department of Labor online.
1964: Head Start
This pre-school education program was a part of the 1964 Economic Opportunity Act that was designed to reduce disparities among young children. The 1994 Head Start Act Amendments established the Early Head Start program, which expanded the benefits of early childhood development to low income families with children under three years old.
In 2016 the program served up to 900,000 mostly low-income children per year with total federal spending of over $8.7 billion. While the program’s effectiveness has been criticized by prominent researchers, recent studies show the benefits of Head Start, especially for children at the bottom of the skill distribution.
For more information on Head Start, visit the Office of Head Start online.
1964: Supplemental Nutrition Assistance Program (SNAP)
The first Food Stamp program ran from 1939-43, but the program we know today was established with the 1964 Food Stamp Act. The program is now known as the Supplemental Nutrition Assistance Program, and served 44.2 million people with $66.5 billion in benefits in 2016.
Studies co-authored by Research Affiliate Hilary Hoynes found that SNAP contributed to increases in birth weights, but also found that the benefit is associated with fewer hours worked.
For more information on the program, visit the Food and Nutrition Service website for SNAP.
1965: Medicare/Medicaid
These health programs were established with amendments to the Social Security Act in 1965. Today, Medicare provides health insurance for people over 65 years of age and some younger than that but who have certain disabilities or diseases. Medicaid is a Federal and state partnership that provides health coverage for people with low income.
During 2015, enrollment in Medicare averaged about 55.3 million people who received $615.6 billion in benefits. In fiscal year 2015, total Medcaid spending was $552.3 billion, of which federal spending for Medicaid was $348 billion ($301 billion covered benefits for enrollees). States funded the additional $220 billion. Approximately 68.5 million people were enrolled in Medicaid or the Children’s Health Insurance Program (CHIP) in 2015.
For more information about Medicare and Medicaid, visit the Centers for Medicare and Medicaid Services online.
1972: Supplemental Security Income Program (SSI)
SSI is a Federal program that provides income people 65 or older as well as to blind or disabled adults and children. The 2016 benefit amount for individuals on SSI was $733, and for couples it was $1,000.
At a cost of $58 billion, SSI was the second-largest means-tested cash assistance program in 2016, behind the Earned Income Tax Credit.
For more information about SSI, visit the Social Security SSI pages online.
1972: Women, Infants and Children (WIC)
WIC is a nutrition program that benefits pregnant women, new mothers and young children who live near poverty and who are at nutritional risk. WIC is not an entitlement program, so the number of people who receive the benefits depends on the amount Congress allots for the program from year to year.
About 7.3 million people participated in WIC in 2016, at a total food cost of $3.6 billion. A study by Center for Poverty Research Director Ann Huff Stevens, Deputy Director Marianne Page and Research Affiliate Hilary Hoynes found that WIC leads to a ten percent increase in the birthweight of infants born to participating mothers.
For more information on the WIC program, visit the USDA online.
1972: Federal Pell Grant Program
Pell Grants help pay for tuition and other expenses for low-income college students. In 2010, three-fourths of recipients had a family income of $30,000 or less.
The grant amount is based on family income and education costs, and also varies from year to year. The 2016-17 maximum grant amount was $5,830. Federal spending on Pell Grants in 2016 school year was about $26.6 billion, with approximately 7.1 million recipients.
With recent increases in tuition, Pell Grants fund a smaller percentage of a higher education. According to the Congressional Budget Office, the average Pell Grant today pays for a smaller percentage of tuition than it did in the 1980s.
For more information on Pell Grants, visiting the U.S. Department of Education online.
1975: The Earned Income Tax Credit (EITC)
The EITC is a tax credit that benefits working people who have low to moderate income, especially families. In 2015, the EITC reached 46.2 million tax filers at a total cost of $58.8 billion. Since EITC benefits are not considered income for other Federal benefit programs, they do not jeopardize recipients who qualify for other assistance like SNAP or Medicaid.
Research has shown that the impacts of the EITC are wider than raising families out of poverty. A study by Center Research Affiliates Hilary Hoynes and Douglas Miller found that it also increased birth weights and reduced low birth-weight births.
For more information on the EITC, visit the Internal Revenue Service online.
1996: Temporary Assistance for Needy Families (TANF)
TANF issues federal grants to states for programs that provide temporary benefits to families with children when the income does not provide for the family’s basic needs. Programs include job preparation, family planning and other benefits as well as cash assistance.
The program replaced the Aid to Families with Dependent Children program (AFDC), which was established by the 1935 Social Security Act. In 1996 it was replaced by TANF as part of the Personal Responsibility and Work Opportunity Act welfare reform that would change the face of the safety net in the U.S. While AFDC allowed families to receive assistance for as long as they were eligible, TANF imposes a five-year limit on benefits.
While the federal government funds a share of state TANF programs, it leaves it to states to determine the shape those programs take. In 2015, the total Federal cost for TANF was about $16 billion, with an additional $15.3 billion coming from states. That year, the program provided cash assistance to about 3 million people.
For more information about TANF, visit the Office of Family Assistance online.
1997: Children’s Health Insurance Program (CHIP)
CHIP provides health coverage to nearly ninemillion children in families who cannot afford private health insurance but who have incomes that are too high to qualify for Medicaid.
The Children’s Health Insurance Program Reauthorization Act of 2009 strengthened CHIP with additional funding and improvements, including tens of millions of dollars for a national outreach campaign, grants to Indian Tribes and to promote enrollment and retention in both CHIP and Medicaid.
In FY 2016, over 8.9 million children enrolled in CHIP at a total cost of $15 billion in Federal funds. Like Medicaid, CHIP is administered by the states that receive matching funds from the Federal government. In a study, Center for Poverty Research Faculty Affiliate Erin Hamilton and Graduate Student Fellow Ethan Evans find that state-level CHIP policies impact whether the children of immigrants get access to healthcare.
For more information about CHIP, visit Medicaid’s page for the program online.
2010: The Affordable Care Act (ACA)
The ACA is the largest recent expansion to the U.S. safety net, the full impact of which remains on the horizon. Implemented by President Obama in 2012, the law includes subsidies to help pay for individual health insurance. It also allows states to cover additional low-income families under Medicaid by providing Federal matching funds. In September, the Congressional Budget Office estimated that the total cost of all of the ACA’s health insurance provisions for people under age 65 was $705 billion in 2017.
The Center for Poverty Research hosted a conference that brought together a unique mix of researchers, policy professionals and industry leaders to discuss what the new law means for health care in this country, as well as its possible impacts on domestic poverty. Audio recordings of selected presentations and other health care-related materials are available on our website.
For key features of the ACA, visit the U.S. Department of Health and Human Services online.
updated 10/30/25
References:
Banthin, J., S. Masi. Congressional Budget Office. May 2013. “CBO’s Estimate of the Net Budgetary Impact of the Affordable Care Act’s Health Insurance Coverage Provisions Has Not Changed Much Over Time.” <http://www.cbo.gov/publication/44176>. Accessed 12/6/13.
Carrington, W. Congressional Budget Office. 2012. “Unemployment Insurance in the Wake of the Recent Recession.” <http://www.cbo.gov/sites/default/files/cbofiles/attachments/11-28-UnemploymentInsurance_0.pdf>. Accessed 12/6/13.
Carrington, W., M. Dahl, and J. Falk. Congressional Budget Office. 2012. “Growth in Means-Tested Programs and Tax Credits for Low-Income Households.” <http://www.cbo.gov/sites/default/files/cbofiles/attachments/43934-Means-TestedPrograms.pdf>. Accessed 12/6/13.
Congressional Budget Office. “Children’s Health Insurance Program Spending and Enrollment Detail for CBO’s May 2013 Baseline.”<http://www.cbo.gov/sites/default/files/cbofiles/attachments/44189-CHIP.pdf>. Accessed 1/15/14.
Hearne, Jean., J. Topoleski. Congressional Budget Office. September 2013.”An Overview of the Medicaid Program.” <http://www.cbo.gov/publication/44588>. Accessed 12/6/13.
Page, S., M.B. Larner. “Introduction to the AFDC Program.” Future of Children. <http://www.princeton.edu/futureofchildren/publications/docs/07_01_01.pdf>. Accessed 12/6/13.
Social Security Administration. “Social Security History.” <http://www.ssa.gov/history/>. Accessed 12/2/13.
Social Security Administration. “Social Security Fact Sheet.” <http://www.ssa.gov/pressoffice/basicfact.htm>. Accessed 12/5/13.
United States Department of Agriculture Economic Research Service. “WIC Program Background.” <http://www.ers.usda.gov/topics/food-nutrition-assistance/wic-program/background.aspx#.Up5F4MRDuSo>. Accessed 12/2/13.
United States Department of Agriculture. “Supplemental Nutrition Assistance Program Participation and Costs.” December, 2013. <http://www.fns.usda.gov/pd/SNAPsummary.htm>.
U.S. Social Security Administration. “Annual Statistical Supplement, 2012.” <http://www.ssa.gov/policy/docs/statcomps/supplement/2012/2b-2c.html#table2.b1>. Accessed 12/4/13.