How is poverty status related to disability? Official data breakdown
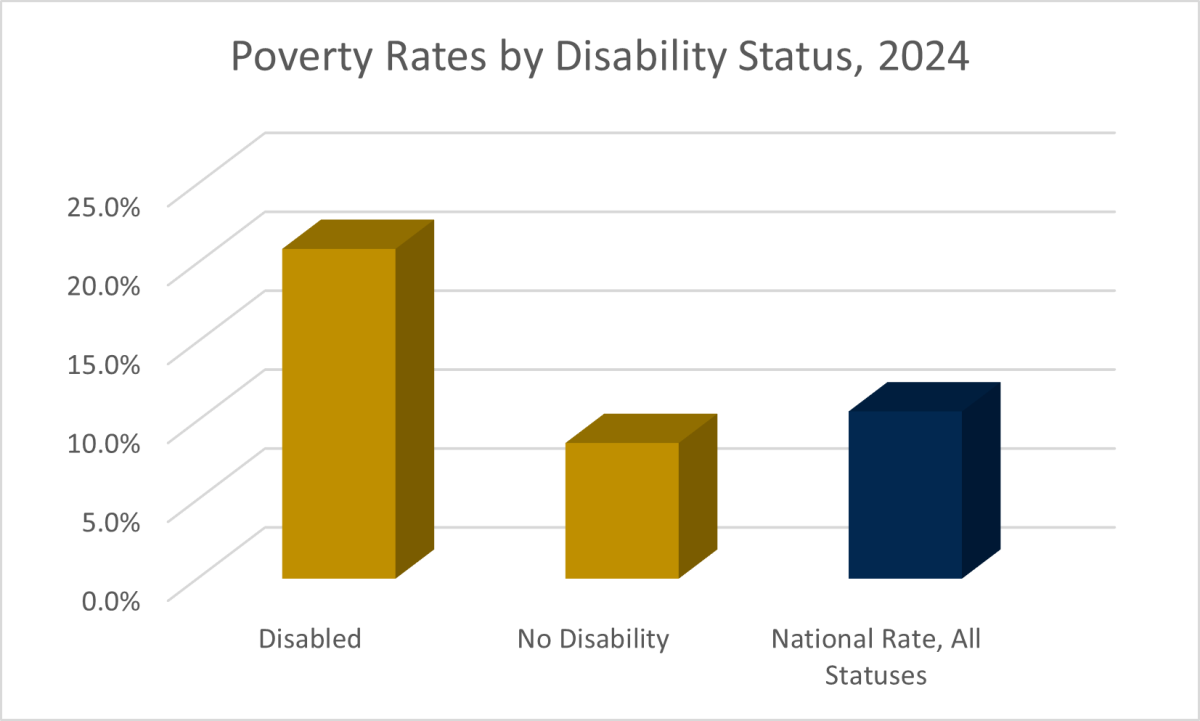
In 2024, the overall poverty rate was 10.6%. Poverty rates
by disability status* in the United States ranged from 8.6% to
20.9%.
Poverty rates by disability status for those ages 18 to 64 were
8.6% for those without a disability
20.9% for those with a disability
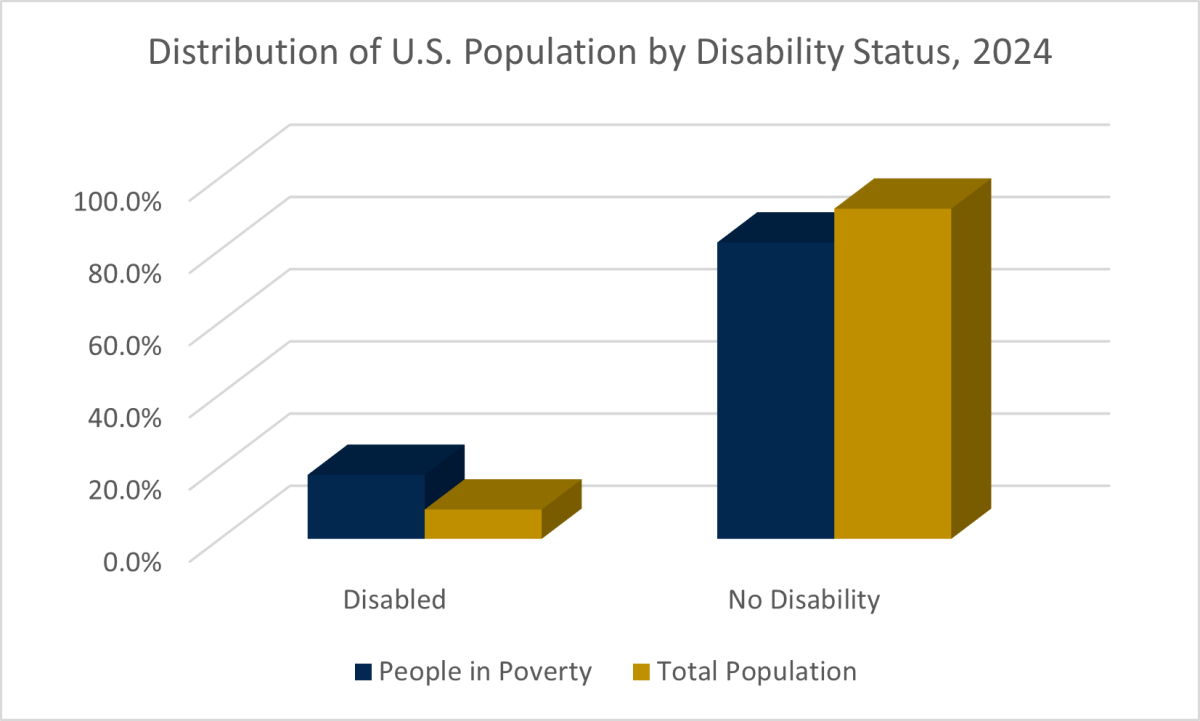
Another way to think about the relationship between poverty and
disability is to look at how the distribution of people in
poverty by disability status compares to that of the population
as a whole.
By that measure, in 2024 the disabled comprise a greater share of
the population in poverty than their share of the general
population; while those without a disability are
underrepresented.
* These rates are for those ages 18-64 and they do not include
members of the Armed Forces because disability status is not
defined for them.
Source: Emily A. Shrider and Christina
Bijou Issued, Poverty in the United States: 2025, U.S. Census
Bureau, Current Population Reports P60-287, (PDF)
U.S. Government Printing Office, Washington, DC, 2025. Accessed
12/17/2025
The official poverty statistics, which have been in use since the
1960s, calculate poverty status by comparing a family’s or
an individual’s cash income to their poverty threshold.