How does family structure relate to poverty? Official data breakdown
In 2024, the overall poverty rate was 10.6%. Approximately
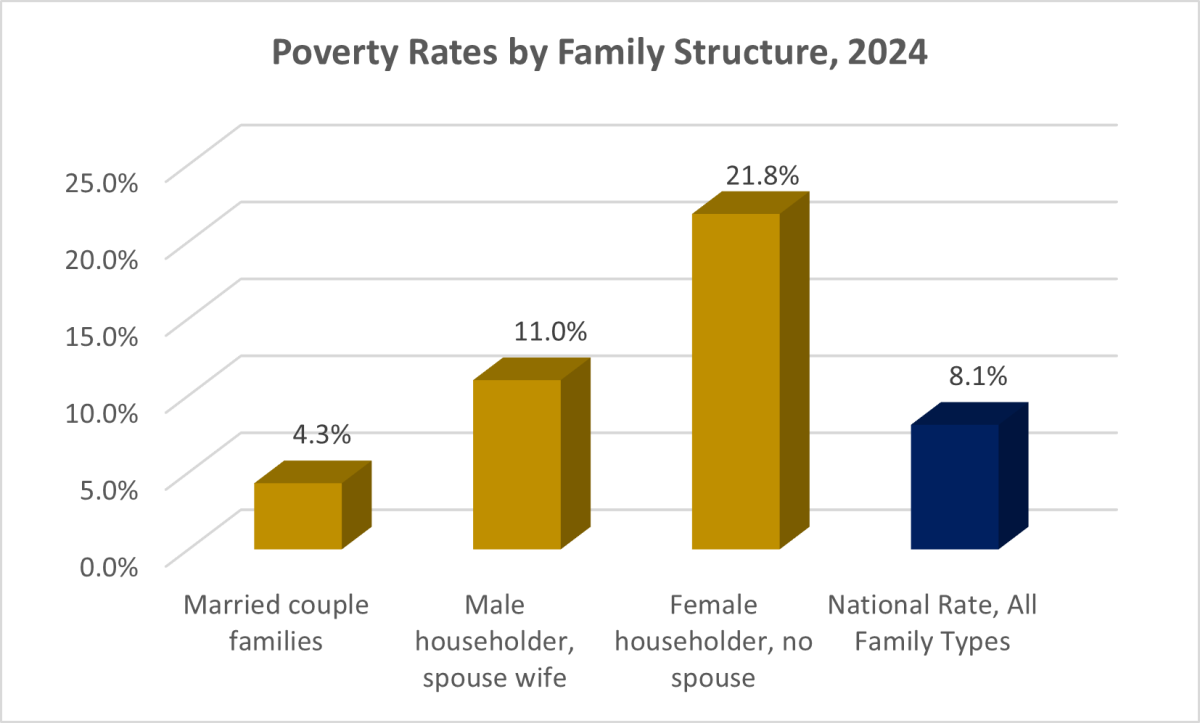
8.1% of all families in the United States were in
poverty. Poverty rates by type of family ranged from 4.3%
to 30.8%.
The poverty rates by type of family were:
4.3% of married couple families were poor
11% of families with male householder, no spouse present
were poor
21.8% of families with a female householder, no spouse
present were poor
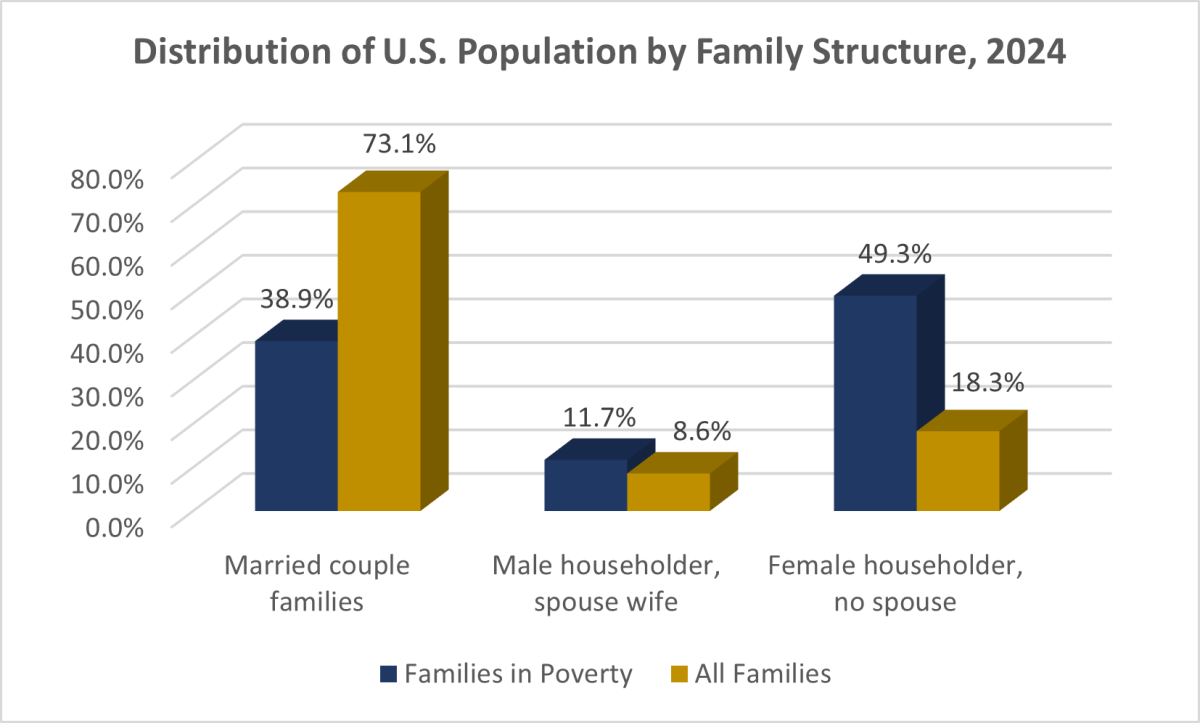
Another way to think about the relationship between poverty and
family structure is to look at how the distribution of families
in poverty by type compares to that of the population as a whole.
By that measure, in 2024 the single parent households (both
male and female householder, no spouse present) comprised a
greater share of families in poverty than their share of the
general population and married couple families are
underrepresented.
Source:
Emily A. Shrider and Christina Bijou,
Poverty in the United States: 2024 U.S.
Census Bureau. Current Population Reports P60-287, U.S.
Government Printing Office, Washington, DC, 2025. (PDF)
Accessed 12/19/2025
The official poverty statistics, which have been in use since the
1960s, calculate poverty status by comparing a family’s or
an individual’s cash income to their poverty threshold.