U.S. Safety Net Protects Most Children in Poor Households During Recessions
By Marianne Bitler, UC Davis; Hilary Hoynes, UC Berkeley; and Elira Kuka, Southern Methodist University
The Great Recession led to unemployment rates unseen since the deep recessions of the early 1980s. At the same time, significant changes in the safety net both before and during the downturn have changed the way we support children in vulnerable households. In a new study,[1] we examine how and to what extent the current safety net provides protection to at-risk children during economic downturns. We find that increases in unemployment affect children in the poorest households most. We also find that while the safety net is strongest at stabilizing household incomes for these children, children in immigrant households get no protection.
Children are particularly vulnerable during economic downturns. As an age group, children already consistently have the highest poverty rates in the nation. Research shows that poverty during childhood can have severe and life-long impacts, including stunted physical and cognitive development, limited lifetime earnings and long-term health problems.[2]
Key Facts
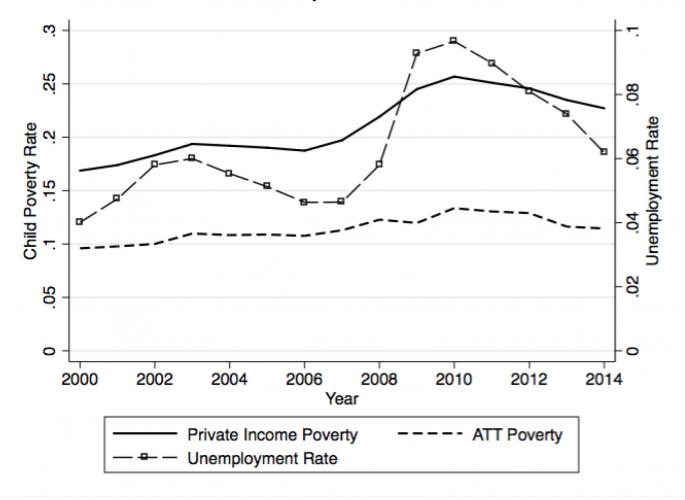
- On average, from 2000-14, a 1 percentage-point increase in unemployment led to a nearly equal increase in the likelihood a child’s household income fell below poverty.
- The safety net reduces this cyclical risk: based on after-tax-and-transfer income, during the same period a 1 percentage-point increase in the unemployment rate led to a 0.5 percentage point increase in the likelihood that a child’s household income falls below its poverty threshold.
- Safety net programs have the largest protective power for children in the poorest households. The effects are larger for households at 50% or below poverty than households at 100%, 150% or 200% of poverty.
- For children in immigrant households, the safety net does little to mitigate these risks.
The rise in unemployment during the 2007-09 Great Recession had a major impact on the number of children living in poverty. By October of 2009, 15.6 million people were out of jobs as the national unemployment rate reached a peak of ten percent. The official poverty rate among children under 18 increased from 18 percent in 2007 to a high of 22 percent in 2010.[3]
Households with the lowest incomes are most likely to rely on the social safety net to help make ends meet during times of high unemployment, and children are the largest beneficiaries. However, research is still seeking to understand just how well our current safety net supports poor individuals, families and, especially, children during hard economic times. Our new study finds that it did protect most children, especially those in the poorest households. However, we also find that the current safety net does not support the children of immigrants, which puts them at a deeper disadvantage.
Measuring Change in Child Poverty
Our study focused on how increases in the unemployment rate affects poverty rates for children under 18 given the current safety net. We used a state panel fixed effects model to measure these changes over time within each state to account for individual economic, social and other characteristics that can vary between states. To measure poverty rates we use the Annual Social and Economic Supplement (ASEC) of the Current Population Survey (CPS) for years 2000-14, which includes the 2007-09 Great Recession as well as the smaller national economic recession of 2001.
To understand the overall impact of the current safety net programs, we compared results for two measures of child poverty. “Private income poverty”—which includes earned income and private transfers such as child support or private disability—shows poverty levels before supports from safety net programs. “After-tax-and-transfer poverty” adds safety net cash and in-kind income and subtracts payroll and income taxes. It includes private income plus transfers from programs such as the EITC and Child Tax Credit, Unemployment Insurance, Social Security, SSI, TANF, food stamps (SNAP), housing subsidies and others.
Our poverty thresholds are similar to those used in the U.S. Census Bureau’s supplemental poverty measure. We assign a child to be in poverty if their household’s after tax and transfer income is below the poverty line. We also provide a second child poverty measure using the household’s private income. By comparing the two measures we can assess the role of the social safety net in affecting child poverty.
Programs Slowed Rise in Child Poverty
Our study shows that increases in the unemployment rate lead to increases in child poverty, both in terms of private income and after-tax-and-transfer poverty. On average, from 2000-14, a one percentage-point increase in the unemployment rate led to a 0.9 percentage-point increase in the likelihood that a household’s private income will fall below its poverty threshold.
However, smaller increases in children’s after-tax-and-transfer poverty shows that the safety net as a whole partially stabilizes household incomes. For example, from 2007-10 the proportion of children in households below 100 percent of their private-income poverty threshold rose by six percentage points, from 19.7 to 25.7 percent. By the after-tax-and-transfer measure, child poverty rose by only 2.1 percentage points, from 11.3 to 13.4 percent.
Safety Net Protects the Very Poor
Children in the poorest households are most at risk to the household income shocks that come with increases in unemployment, both in terms of private income and after-tax-and-transfer income. For these children, protection by the safety net was also most pronounced. A one percentage point increase in the unemployment rate increased private-income poverty by 0.5 percentage points for children in households at 50 percent of poverty. By the after-tax-and-transfer measure the increase for these children was 0.2 percentage points.
For children in households below 100 percent of poverty, a one percentage point increase in the unemployment rate led to a 0.9 and 0.5 percentage-point increases in private-income and after-tax-and-transfer and poverty, respectively. This difference between the cyclicality of private income and after-tax-and-transfer poverty narrows at higher household income levels, coming close to being equal at 200 percent of poverty.
Safety Net Does Not Protect All Children
This protective effect was not the same for all children. Most significantly, children who lived with a head of household (or their spouse) who was an immigrant were much more vulnerable to a given change in the unemployment rate. Adding in safety net income has no mitigating effect on their poverty rates. For these children, a one-percentage-point increase in unemployment led to a similar 1.2 percentage point increase in poverty by both the private income and after-tax-and-transfer measures.
One possible reason for the ineffectiveness of the safety net in protecting this group of children is that a large share of the safety net is either unavailable to many immigrants, because of their unauthorized status, or access is limited. This is particularly the case for those who entered the country after August 1996, due to immigration provisions in PWRORA, as well as the 1986 Immigration Reform and Control Act (IRCA) that disqualifies new immigrants all forms of public assistance for five years.
Marianne Bitler is a professor of Economics at UC Davis.
Hilary Hoynes is a professor of public policy and economics and Haas Distinguished Chair in Economic Disparities at the Goldman School of Public Policy at UC Berkeley.
Elira Kuka is an assistant professor of economics at Southern Methodist University.
[1] Bitler, M. et al. 2016. “Child Poverty, the Great Recession, and the Social Safety Net in the United States.” Journal of Policy Analysis and Management.
[2] For example see, Brooks-Gunn, J. and Duncan, G. 1997. “The Effects of Poverty on Children.” The Future of Children.
[3] DeNavas-Walt, C. and Proctor, B. 2014. “Income and Poverty in the United States: 2013.” U.S. Census Bureau.
#povertyresearch


