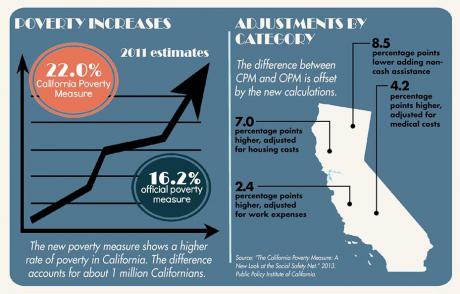
This infographic shows the difference in California poverty rates
when calculated with the Official Poverty Measure (OPM) and the
California Poverty Measure (CPM). Developed by the Public Policy Institute of
California and the Stanford Center on Poverty
and lnequality, the CPM includes differences in non-cash
assistance and cost-of-living in order to provide a more holistic
picture of poverty in the state.
This infographic shows the impact the Affordable Care Act, passed
in 2010, has on poverty in the U.S. These include reductions in
the number of uninsured among the poor and additional services,
including mental health and substance abuse treatment, as well as
funding to support safety net hospitals with high rates of
uncompensated care.