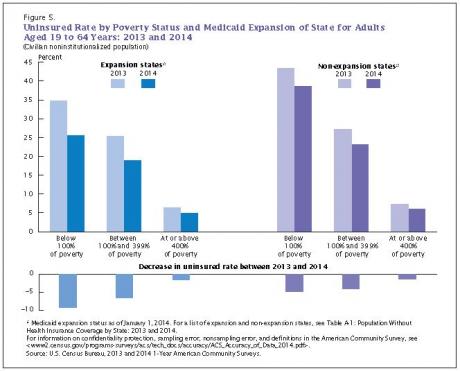
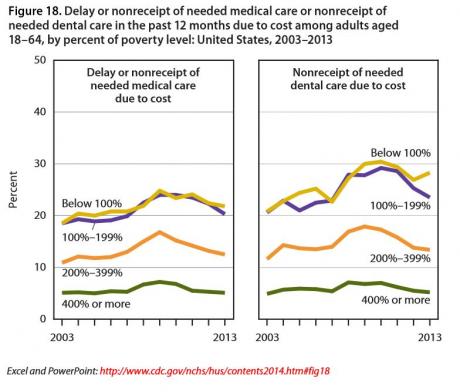
How is poverty related to access to care and preventive healthcare? Data from the Centers for Disease Control
The Centers for Disease Control and Prevention produce data on
health and healthcare in the United States. Health, United
States includes a variety of tables with breakdowns by poverty
status.
In 2012-2013 their data for children under 18 with “no usual
source of healthcare” show
4% of all children had no usual source of healthcare
for poor children the rate was 6%
Children under 6 were less likely than those 6 to 17 to have no
usual source of healthcare (3% vs. 5%). Uninsured children
were ten times more likely than insured children to have no usual
source of healthcare (28% vs. 2%). For uninsured children
under 6 the rate was 20% and for those age 6 to 17 the rate was
29%.
For adults ages 18-64 data on “no usual source of healthcare”
show
20% of all adults ages 18 to 64 had no usual source of
healthcare
the rate for poor adults in that age group was 33%
adults ages 18 to 44 were less likely than those ages 45 to
64 to have no usual source of healthcare (25% vs. 12%)
The rate was highest for uninsured adults at 54%
The rate was lowest for insured adults at 11%
In 2013, data on preventive care show that
Sixty-seven percent of all women ages 40 and over had a
mammogram. The rates vary by income level:
50% of women at or below the poverty level
57% of women between 100-200% of the poverty level
77% of women at 400% or more of the poverty level
Fifty-five percent of adults 50 to 75 had colorectal tests
or procedures. The rates vary by income level:
41% of adults at or below the poverty level
45% of those between 100-200% of the poverty level
63% of those at 400% or more of the poverty level
Source:
National Center for Health Statistics.
Health, United States, 2014. Hyattsville, MD., 2013. Tables
712-73, 83, 85 (PDF) Accessed
11/12/2015