Adjusting Weighted Pupil Funding for Concentrated Poverty in California Schools
by Margaret Weston, UC Davis
The California state legislature’s 2013 budget deal included an overhaul of the state’s school finance system, which has long been criticized for being inequitable, inadequate and overly complex.
The budget allocates the vast majority of state funds through a “weighted pupil funding formula” (WPF), which involves base funding for all students as well as additional funding for the plan’s targeted disadvantaged students.
The disadvantaged students this plan targets are English learners, foster youth and low-income students as defined by eligibility for free or reduced-price lunch. Districts in which more than 55 percent of the students are those targeted students would receive even more funding through a concentration grant.
By targeting disadvantaged students, the plan brought renewed attention to the relationship between economic disadvantage and achievement. This policy brief, based on a new study in which Heather Rose and Margaret Weston estimate the funding needed to improve disadvantaged students’ academic achievement, reviews academic research on concentrated poverty to understand whether weighted pupil formula is the most effective way to target disadvantaged students.
Poverty and Student Outcomes
On average, students from low-income families struggle
academically. In 2011, Reardon found that the income achievement
gap is almost twice the black-white test gap, and has grown by
more than 30 percent since 1970.
Researchers have also documented the strong negative effects of living in a poor neighborhood and attending a high-poverty school. Students in high poverty schools have lower levels of academic proficiency and are less likely to graduate from high school, to attend college and to get jobs.
In 1997, Caldas & Bankston found that the socioeconomic status of peers has a significant, independent effect on a student’s achievement that is only slightly smaller than the effect of a student’s own family background. Students who are not poor but who attend high-poverty schools are more likely to struggle academically than poor students in low-poverty schools.
Defining Disadvantage
One challenge in effectively targeting the most disadvantaged
students is in figuring out the most accurate measure to identify
them. The U.S. Census Bureau defines “poverty areas” as census
tracts with 20 percent or more of its population living below the
federal poverty line. Each year, the Census Bureau estimates the
poverty rates in school districts.
Researchers typically use a 40 percent poverty rate to define concentrated poverty. Others use a threshold of at least 50 percent, or create quartiles of poverty. Rather than rely on Census estimates, researchers typically estimate school poverty by counting the number of students on subsidized lunch.
To qualify for free lunch, family income must be less than 130 percent of the federal poverty line ($29,008 in 2010). To qualify for reduced-price lunch, income must be less than 185 percent of the federal poverty line ($41,281 in 2010). The National Center on Education Statistics (1996) defines a high-poverty school as one in which at least 40 percent of the student body is enrolled for subsidized meals.
The two measures of school poverty—federal poverty measures and enrollment rates for subsidized lunch—are highly related. Approximately 33 percent of students enrolled for free and reduced-price lunch live in poverty. The standard 40 percent poverty threshold is similar to an 80- to 90-percent threshold of free and reduced-price lunch.
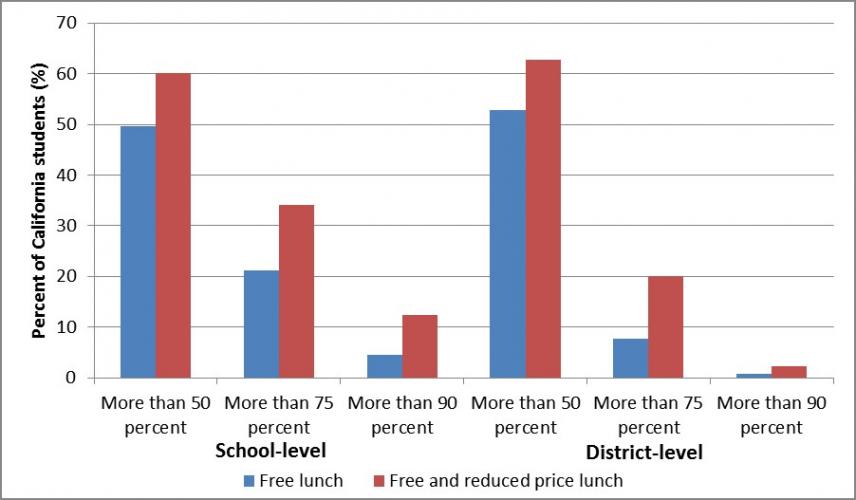
Figure 1 shows the concentration of free and reduced price lunch students within California schools and districts. Approximately 60 percent of California’s students attend schools in which more than 50 percent of students are eligible for free or reduced-price lunch. More than 10 percent of students are in schools with more than 90 percent of students on subsidized meals.
Current Concentration Factors
The body of research makes clear that students in high-poverty
schools are even more disadvantaged than students simply defined
as low-income by federal measures. So far, however, the
discussion around California’s concentration grant has related to
only district-level concentrations of poverty.
One major concern about district-level measures is that some students will not be served. Poverty is not always equally distributed across schools within a district. In 2010-11, 591 schools serving six percent of California students had more than half of their students on free or reduced price lunch but were in districts that do not meet the district-level threshold to win a concentration grant. Under this plan, these schools are ineligible for any additional funding.
A second major concern is that funds may not reach the neediest students. Reviews of Title I, a federal program that provides funding to help low-achieving students in highpoverty schools, find evidence that overall school funding does not increase significantly with the receipt of Title I funds. This means that districts may reduce or redistribute state and local funds away from Title I schools and the students they were intended to support.
The California civil rights community has expressed concern that without regulatory strings to ensure that funds reach targeted students, districts may distribute these funds more equally across schools. In the coming year, the State Board of Education will draft policies and regulations to make sure.
Grant Alternatives
To combat some of these negative incentives, in 2007, Richard J.
Murnane proposed offering competitive matching grants to school
districts in a similar manner to the Obama Administration’s Race
to the Top competitive grants. The matching component ensures
that total funding per pupil increases, that the competitive
component ensures community buy-in, and that districts use
research-driven strategies to improve achievement among poor
students.
Competitive grants would also ensure that funds are used in new ways, rather than in common Title I fund uses that have been generally ineffective. Of course, a program of competitive concentration grants may not be politically feasible or desirable. Some poor students, by virtue of where they live, would not be awarded a grant.
Regardless, it is clear that under our current system, a majority of California’s students are low-income and attend schools with many other low-income students. These disadvantaged students currently have lower average achievement than non-poor students and are more likely to have adverse long-term outcomes. These students warrant additional consideration, whether in a WPF or a supplemental grant. In the coming years we will see how California’s definition of poverty—the formula which determines the grant—will serve the students it was designed to help.
Meet the Researcher
Margaret Weston is pursuing a Ph.D. in school organization
and education policy at UC Davis. She is also a policy fellow at
the Public Policy Institute of California’s Sacramento Center,
where her work focuses on topics in public and school finance.
References
and Further Reading
Barondess, H., Hahnel, C, Stewart, J. 2012. Tipping the Scale
Towards Equity: Making Weighted Student Formula Work for
California’s Highest-Need Students. Oakland, CA: Education
Trust-West
Blau, P. & Duncan, O.D. 1967. The American Occupational Structure. New York: John Wiley.
Brooks-Gunn, J., Duncan, G., Klebanov, P., & Sealand, N. 1993. “Do Neighborhoods Influence Child and Adolescent Development?” American Journal of Sociology, 99(2), 353-395.
Caldas, S.J., Bankston III, C. 1997. “Effect of School Population Socioeconomic Status on Individual Academic Achievement.” The Journal of Educational Research, 90(5): 269-277.
Campaign for Quality Education. 2012. “The Campaign for Quality Education Supports Governor Brown’s Weighted Pupil Formula Proposal and Urges Action on It This Year. May 10 press release.
Clarke, R.L. 1992. “The Neighborhood Effects of Dropping Out of School among Teenage Boys.” Washington, D.C.: The Urban Institute.
Coleman, J.S., Cambell, E.Q., Hobson, C.S., McPartland, J., Mood, A.M., Weinfeld, F.D., & York, R.L. 1966. Equality of Educational Opportunity. Washington, D.C.: U.S. Department of Health, Education, and Welfare.
Crane, J. 1991. “The Epidemic Theory of Ghettos and Neighborhood Effects on Dropping Out and Teenage Childbearing.” American Journal of Sociology, 96(5): 1226-1259.
Darling-Hammond, L. 2004. “What happens to a dream deferred? The continuing quest for educational equality.” Handbook of Research on Multicultural Education, J.A. Banks & C.M. Banks (eds.) San Francisco: Jossey Bass.
Dupéré, V., Leventhal, T., Crosnoe, R., & Dion, E. 2010. “Understanding the Positive Role of Neighborhood Socioeconomic Advantage in Achievement: The Contribution of Home, Child Care and School Environments.” Developmental Psychology, 46(5): 1227-1244.
Duncan, G.J., Brooks-Gunn, J., Klebanov, P.K. 1993. “Economic Deprivation and Early-Childhood Development.” Child Development, 65(2): 296-318.
Duncan, G.J., Murnane, R.J. 2011. “Introduction: The American Dream, Then and Now.” Whither Opportunity, G.J. Duncan & R.J. Murnane (eds). New York: Russell Sage Foundation Press.
Ellwood, D. 1988. Poor Support: Poverty in the American Family. New York: Basic Books.
Fensterwald, J. 2012. “This Time, Groups Get to Say Their Piece on Weighted Student Funding.” EdSource Today, November 13.
Gordon, N. 2004. “Do Federal Funds Boost School Spending? Evidence from Title I.” Journal of Public Economics, 88(9-10), 1771-1792.
Jencks, C. & Mayer, S.E. 1990. “Social Consequences of Growing Up in a Poor Neighborhood.” In Inner City Poverty in the U.S., L.E. Lynn, Jr & M.G.H. McGearys (eds). Washington, D.C.: National Academy Press.
Kennedy, M.M., Jung, R.K., Orland, M.E. 1986. Poverty, Achievement and the Distribution of Compensatory Education Services. Washington, D.C.: U.S. Department of Education.
Levine, D.U., Keeny, J., Kukuk, C., O’Hara Fort, B., Mares, K.R., & Stephenson, R.S. (1979). “Concentrated Poverty and Reading Achievement in Seven Big Cities.” The Urban Review, 11(2): 63-80.
Murnane, R.J. 2007. “Improving the Education of Children Living in Poverty.” The Future of Children, 17(2): 161-182.
National Center for Education Statistics. 1996. “Urban Schools: The Challenge of Location and Poverty.” Washington, D.C.: U.S. Department of Education.
PPIC School Finance Model. (2012). San Francisco: Public Policy Institute of California. Available at www.ppic.org/main/dataSet.asp?i=1229
Reardon, S.F. 2011. “The widening academic achievement gap between the rich and the poor: New evidence and possible explanations.” Whiter Opportunity, R. Murnane & G. Duncan (eds). New York: Russell Sage Foundation Press.
Rose, H. & Weston, M. (forthcoming). San Francisco: Public Policy Institute of California.
Rose, H., Sonstelie, J. & Weston, M. 2012a. “Funding Formulas for California Schools III: An Analysis of Governor Brown’s Weighted Pupil Funding Formula.” San Francisco: Public Policy Institute of California.
Rose, H., Sonstelie, J. & Weston, M. 2012b. “Funding Formulas for California Schools IV: An Analysis of Governor Brown’s Weighted Pupil Funding Formula, May Budget Revision.” San Francisco: Public Policy Institute of California.
U.S. Census Bureau. 2011. “Areas with Concentrated Poverty: 2006-2010.” Washington, D.C.: U.S. Department of Commerce.
U.S. Census Bureau. Small Area Income and Poverty Estimates. Available: www.census.gov/did/www/saipe/index.html
van der Klaauw, W. 2008. “Breaking the Link Between Poverty and Low Student Achievement: An Evaluation of Title I.” Journal of Econometrics, 142(2): 731-56.
Weston, M. 2012. “School Finance.” San Francisco: Public Policy Institute of California.
Wilson, J.W. 1987. The Truly Disadvantaged: The Inner City, the Underclass, and Public Policy. Chicago: University of Chicago Press.


