
How does geography relate to poverty?
Data for regional and concentrated poverty
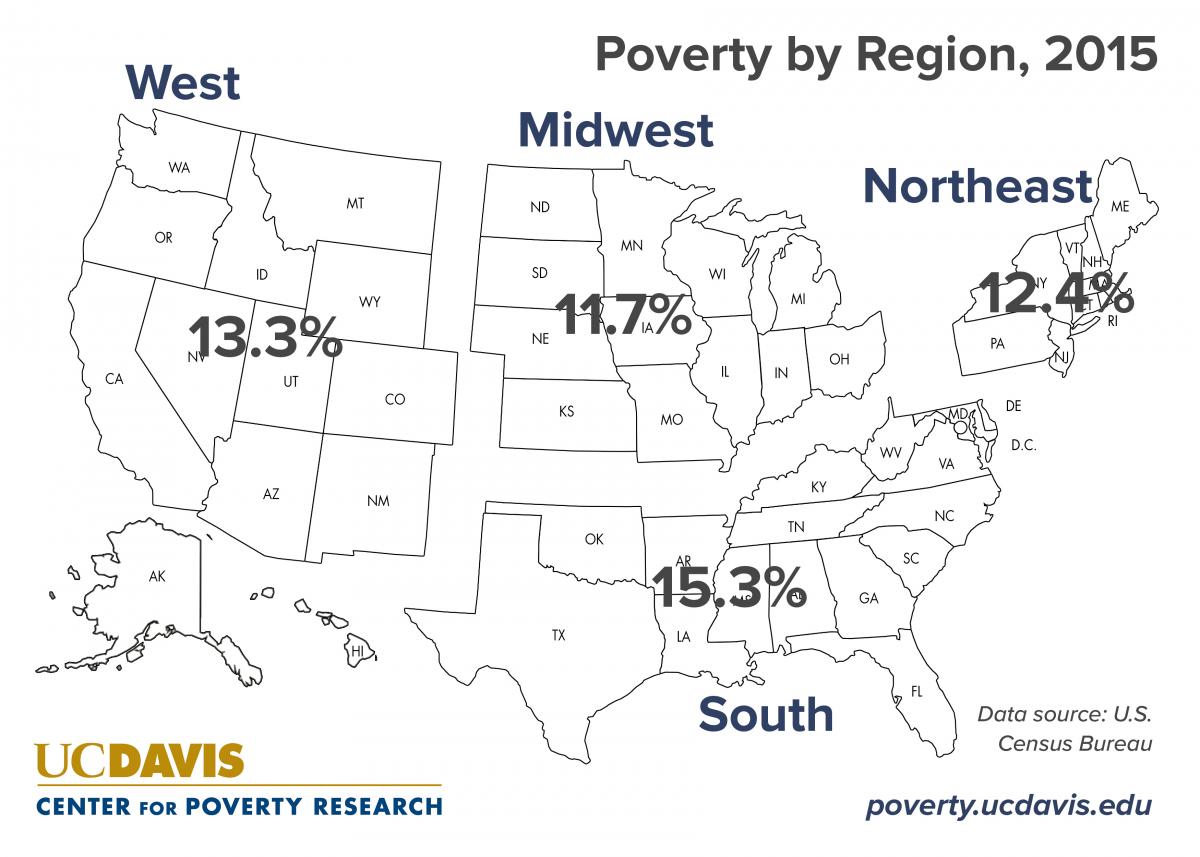
In 2015, poverty rates across the four Census geographic regions ranged from 11.7 percent in the Midwest, 12.4 percent in the Northeast, 13.3 percent in the West and 15.3 percent in the South. Because of the South’s largest share of the total U.S. population, it has the largest number of people who live in poverty compared to any other region.
The poverty rate also varies between metropolitan and non-metropolitan areas. In metropolitan areas, the poverty rate in 2015 was 13 percent, compared to 16.7 percent for non-metropolitan areas. However, because many more people live in metro areas, these areas were home to nearly five times as many of the total poor compared to non-metropolitan areas.
While the most recent Census report on poverty showed improvements in a number of areas, those who live in rural or other non-metropolitan areas did not fare as well. While the poverty rate went down in metropolitan areas by 1.5 percentage points from 2014-15, poverty outside of metropolitan areas actually increased slightly, from 16.5 to 16.7 percent.
What is concentrated poverty?
The U.S. Census Bureau considers census tracts with poverty rates above 20 percent to be “poverty areas.” Some government programs use this definition of concentrated poverty to target resources to low-income communities. Researchers have argued that concentrated poverty may in part result from living geographically far from jobs.
Poverty is not evenly distributed across neighborhoods and every state has neighborhoods with higher than average poverty rates. Five-year estimates from the American Community Survey 2008-2012 data show that 53 percent of all people in the United States live inside poverty areas, including about 54 percent of those in poverty.
The data also show who lives in poverty areas. The vast majority of all children, 72 percent, live outside poverty areas. However, 58 percent of all poor children live in poverty areas. These data also show that Blacks and Hispanics account for larger shares of those who live in poverty areas than their shares of the general population compared to Whites and non-Hispanics.
Updated 9/13/16
For more information:
Bishaw, Alemayehu. 2014. ”Changes in Areas with Concentrated Poverty: 2000-2010.” U.S. Census Bureau. American Community Survey Reports.
Bishaw, Alemayehu. 2011. “Areas with Concentrated Poverty: 2006-2010.” U.S. Census Bureau.
Proctor, Bernadette D. et al. 2015. “Income and Poverty in the United States: 2015,” U.S. Census Bureau.