What are poverty rates among working adults?
Official data by work experience


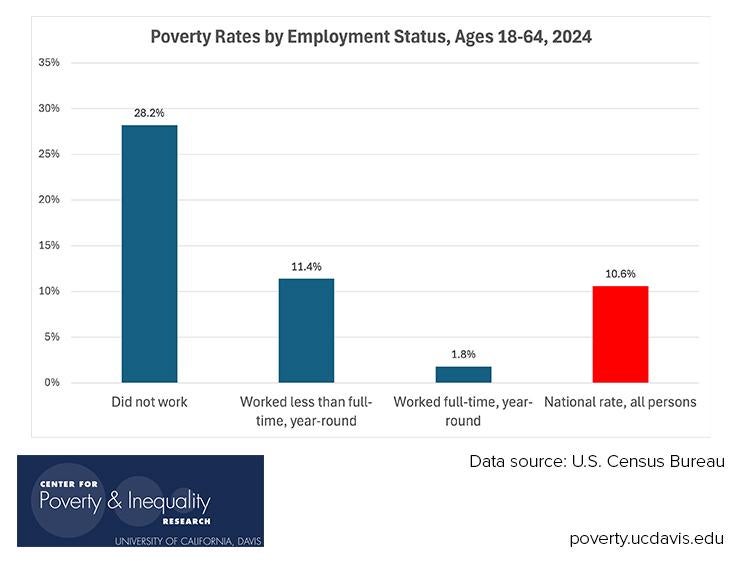
The Census Bureau reports poverty rates by work experience for people ages 18 to 64.  In 2014, the overall poverty rate for people ages 18 to 64 was 14%. 

The poverty rates by work experience for that age group ranged from 3% to 34%.

Another way to think about the relationship between poverty and employment status is to look at how the distribution of people in poverty by their employment status compares to that of the population as a whole.

By that measure, in 2014 those who did not work comprise a far greater share of the population in poverty than their share of the general population and those who worked less than full-time are overrepresented to a lesser degree; while those who worked full-time, year-round were underrepresented.

Source:
DeNavas-Walt, Carmen and Bernadette D. Proctor, Income and Poverty in the United States: 2014 U.S. Census Bureau. Current Population Reports P60-252, U.S. Government Printing Office, Washington, DC, 2015. (PDF) Accessed 10/19/2015

What are the characteristics of minimum wage workers?
Data from the Bureau of Labor Statistics

In 2014, about 1.3 million U.S. workers age 16 and over earned exactly the prevailing federal minimum wage of $7.25 per hour. Another 1.7 million had wages below the federal minimum.  Together these workers make up 4 percent of all hourly paid workers.

Who are the working poor in America?
Data from the Bureau of Labor Statistics

The “working poor” are people who spend 27 weeks or more in a year in the labor force either working or looking for work but whose incomes fall below the poverty level. According to the U.S. Bureau of Labor Statistics, about 9.5 million of people who spent at least 27 weeks in the labor force were poor. That year, the working poor comprised 6.3 percent of all individuals in the labor force.