How is poverty status related to age? Official data for age groups
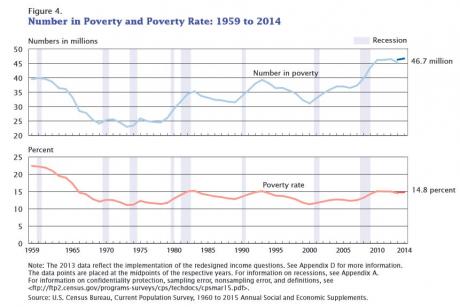
In 2024, the nation’s official poverty rate was 10.6%. The
poverty rates by age groups ranged from 9.6% to 14.3%.
Poverty rates by age were:
14.3% of people aged
under 18
9.6% of people aged 18 to 64
9.9% of people aged 65 and
over
Another way to think about the relationship between poverty and
age is to look at how the age distribution of people in poverty
compares to that of the population as a whole.
By that measure, in 2024 children comprise a greater share
of the population in poverty than their share of the general
population; while other age groups are underrepresented.
The official poverty statistics, which have been in use since the
1960s, calculate poverty status by comparing a family’s or
an individual’s cash income to their poverty threshold.